Visualizing protractor results using Elastic search and Kibana

System Requirement:

This documentation is for windows system. I am using windows 10

Steps:

Installation and visualization in Kibana:

Please refer :

https://praveendavidmathew.medium.com/visualization-using-kibana-and-elastic-search-d04b388a3032

Pre-requisite:

  1. we can delete the previous index by doing a DELETE request to http://localhost:9200/testresults

Now lets come to Protractor:

So from the previous article , you understand how to send data and visualize it in Elastic search

We have observed that we are just sending json data using rest API and then visualizing it in Kibana by setting x and y axis with the fields we are interested in.

so to visualize the protractor result we just have to send the result to ELastic search , this can be done using jasmine customreporter listeners .

in the protractor config file add : (do npm install axios)

onPrepare: async function() {
jasmine.getEnv().addReporter({
        //adding results to an array for each spec
specDone: function(result) {
console.info(JSON.stringify(result, null, 2))
array.push(result)
},
        //iterating through each result and sending it to elastic search
jasmineDone: function() {
date = new Date(Date.now())
var axios = require('axios');
array.forEach((result) => {
result.date = date
var data = JSON.stringify(result);
                var config = {
method: 'post',
url: 'http://localhost:9200/testresults/protractorresults',
headers: {
'Authorization': 'Basic dGVzdDp0ZXN0MTIz',
'cache-control': 'no-cache',
'APIC-Cookie': 'apicCookie',
'Postman-Token': 'ae18aba5-b962-44d4-9a1e-5684f43318d3',
'Content-Type': 'application/json'
},
data: data
};
                axios(config)
.then(function(response) {
console.log(JSON.stringify(response.data));
})
.catch(function(error) {
console.log(error);
});

            })
}
})
}

This will send the results to elastic search after the test is done .

Visualized result:

  1. Goto stack management>kibana>index pattern and create new index testresults
  2. Click next and add date as time field
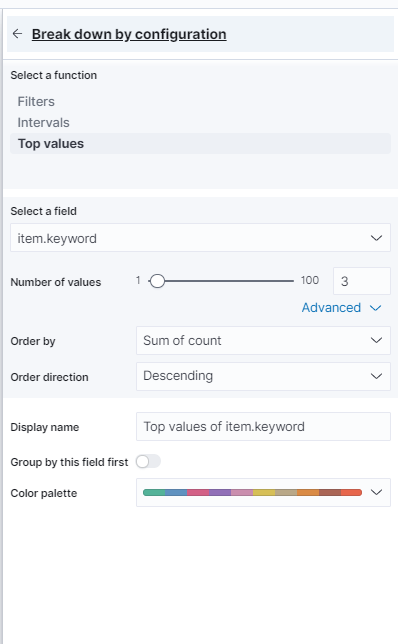
  3. Create new dashboard with horizontal axis as ‘date’ , vertical has ‘keyword.status’ , and breakdown by ‘keyword.status’. Set color code as status.

we have visualized keyword.status in y axis and date field in x axis

Visualization using Kibana and Elastic search

System Requirement:

This documentation is for windows system. I am using windows 10

Introduction:

Elasticsearch is a distributed, RESTful search and analytics engine capable of addressing a growing number of use cases. As the heart of the Elastic Stack, it centrally stores your data for lightning fast search, fine‑tuned relevancy, and powerful analytics that scale with ease.

Kibana is a free and open user interface that lets you visualize your Elasticsearch data and navigate the Elastic Stack. Do anything from tracking query load to understanding the way requests flow through your apps.

Logstash is a free and open server-side data processing pipeline that ingests data from a multitude of sources, transforms it, and then sends it to your favorite “stash.” . We are not using logstash as we are directly adding data to elastic search

Steps:

Installing elastic search and Kibana:

  1. Download the installation file:

https://www.elastic.co/downloads/

Download Elastic search and Kibana windows zip file.

2. Extract the zip file:

3. lets configure simple security settings like username and password, to do this follow below steps:

Update following files : elasticsearch-7.11.1\config\elasticsearch.yml and kibana-7.11.1-windows-x86_64\config\kibana.yml

Add to end of Kibana.yml:

xpack.fleet.enabled: true
xpack.fleet.agents.tlsCheckDisabled: true
xpack.encryptedSavedObjects.encryptionKey: "something_at_least_32_characters"
xpack.security.enabled: true
elasticsearch.username: "test"
elasticsearch.password: "test123"

Add to end of Elasticsearch.yml:

xpack.security.enabled: true
discovery.type: single-node

4. Open cmd with elasticsearch-7.11.1\bin as current directory:

Add elastic search user using below command:

elasticsearch-users useradd test -p test123 -r superuser

This will add user test with admin privilege:

5. Start ElasticSearch and Kibana:

Kibana:

open cmd with current directory as : kibana-7.11.1-windows-x86_64\bin

and run kibana.bat

Elasticsearch:

open cmd with current directory as : elasticsearch-7.11.1\bin

and run elasticsearch.bat

6. Verify installation:

Elasticsearch:

navigate to : http://localhost:9200/ give user name and password as test and test123

you should see output as :

{
"name" : "DESKTsdsd",
"cluster_name" : "elasticsearch",
"cluster_uuid" : "4CbhYSWqAxkSmo_1-3Q",
"version" : {
"number" : "7.11.1",
"build_flavor" : "default",
"build_type" : "zip",
"build_hash" : "ff17057c9c1bbecc727003a907c0db7a",
"build_date" : "2021-02-15T13:44:09.394032Z",
"build_snapshot" : false,
"lucene_version" : "8.7.0",
"minimum_wire_compatibility_version" : "6.8.0",
"minimum_index_compatibility_version" : "6.0.0-beta1"
},
"tagline" : "You Know, for Search"
}

Kibana:

navigate to : http://localhost:5601 give user name and password as test and test123 , and click explore myown

you should see output as:

Adding data to Elasticsearch:

in Elasticsearch:

An index can be thought of as an optimized collection of documents and each document is a collection of fields, which are the key-value pairs that contain your data. By default, Elasticsearch indexes all data in every field and each indexed field has a dedicated, optimized data structure.

in simple word it is like a table

In Elastic search you can add data to a index using rest endpoint , and if no index exists a new index is created automatically.

so lets create data using postman.

the url syntax is :

http://localhost:9200/index/type

so lets our endpoint be :

http://localhost:9200/testresults/protractorresult (Note: you can delete an index by doing Delete on http://localhost:9200/testresults)

and you can send any body , let body be : (add few other items also like books , pencil etc for visualizing)

{
"item":"shampoo",
"count":2
}

now do a post , Make sure you have basic authentication username:password set (test:test123)

Visualizing in Kibana:

Navigate to : http://localhost:5601/app/home#/ > menu (handburger menu onleft top corner) > stack management (http://localhost:5601/app/management)

Click: Kibana>Index Patterns > create index and add testresults* , now this index will be available for visualization.

output:

Navigate to : http://localhost:5601/app/home#/ > menu (handburger menu onleft top corner) > analytics > Discover .

Here you can see the data that we send through postman:

Now create dashboard for visualization:

Navigate to : http://localhost:5601/app/home#/ > menu (handburger menu onleft top corner) > analytics > Dashboard.

  1. Click create new Dashboard
  2. Click create new Panel
  3. Click Lens
  4. Set horizontal axis as :

item.keyword

set vertical axis as :

Breakdown by:

Now the resulting chart will be :

Now click save and it will be navigated to dashboard:

How to test chrome in mobile devices without appium:

You can run chrome in android device straight from selenium:

https://chromedriver.chromium.org/getting-started/getting-started—android

First Connect actual device or emulator:

To start emulator follow the below article about installing android-studio:

https://praveendavidmathew.medium.com/android-studio-7174c43708f6

To connect an actual mobile instead then use below article, read about enabling debugger mode:

https://praveendavidmathew.medium.com/android-studio-7174c43708f6

Second make sure you have latest adb version is installed:

download latest from :

https://developer.android.com/studio/releases/platform-tools

the adb will be inside the platform tool folder

Now make sure device is detected and authorized: (these steps are explained in the above mentioned articles)

open the folder in which abd is there and run the below command ./adb

./adb devices

And make sure device shows in the list

make sure it is showing device and not unauthorized:

Now you can run below code:

Here we are using experimental_option “androidPackage” to connect to chrome in mobile device

you can add experimental option (for any binding )

Python:

options = webdriver.ChromeOptions()
options.add_experimental_option('androidPackage', 'com.android.chrome')
driver = webdriver.Chrome('./chromedriver', options=options)
driver.get('https://google.com')
driver.quit()

Java:

System.setProperty(“webdriver.chrome.driver”,””);
ChromeOptions options = new ChromeOptions();
options.setExperimentalOption(“androidPackage”, “com.android.chrome”);
WebDriver driver = new ChromeDriver(options);
driver.get(“https://www.google.com");

You can see how to inspect from desktop here:

https://praveendavidmathew.medium.com/android-studio-7174c43708f6

How to run postman requests using Tags

Get all requests in the collection:

you can also get information about all the requests in a collection by using :

https://api.getpostman.com/collections/{{collection_UUID}}

to get uuid and api key goto :

https://app.getpostman.com

Now for generating api key >

goto account settings > api key and generate api key.

to get collection uuid goto specific workspace and collection and copy the uuid part from url:

Note: you can also get UUID by clicking collection and clicking info panel on the right side

Now in your collection

Rename all requests as:

get user details [Regression][Smoke][Somethingelse]
get account details [Regression]

Then Create a new request called initial request and keep it as the first request in your collection:

url: https://api.getpostman.com/collections/8xxxxtheuuidyoucopied

authorization: apikey-header : key: X-Api-Key and value: yourapikey

test-script :

pm.environment.unset("requestToRun")
reqeustlist = pm.response.json().collection.item.map((a) => a.name)
requestToRun = reqeustlist.filter((a) => a.includes(pm.environment.get("tag")))
let val = requestToRun.pop()
pm.environment.set("requestToRun", requestToRun)
val ? postman.setNextRequest(val) : postman.setNextRequest(null)

Now set the envirnoment variable as what you want to look for eg: run script that contains text “Regression” then set pm.environment.set("tag","Regression")

Now in your collection-pre-request add:

if (pm.info.requestName !== "initial request") {
let requestToRun = pm.environment.get("requestToRun")
let val = requestToRun.pop()
pm.environment.set("requestToRun", requestToRun)
val ? postman.setNextRequest(val) : postman.setNextRequest(null)
}

Output:

Ran only reqeusts that has “Copy” in its name

Example collection:

https://www.getpostman.com/collections/73e771fe61f7781f8598 , you can click ctrl+o and choose link to import this collection

Note: In newman you can pass the environment variable as “ — env-var tag=Regression”

Getting Started with Appium android

appium

step towards mobile automation….

Description:

Have you always wanted to get into mobile test automation space but was reluctant thinking you have no clue where to start?

Then here you go , a simple article outlining how to setup android emulator and find the locators for the elements using Appium desktop app and Android studio

(The Android Emulator simulates Android devices on your computer so that you can test your application on a variety of devices and Android API levels without needing to have each physical device)

Android Studio

Install Android Studio:

This has the emulator .

https://developer.android.com/studio

Note: you might get an error at the end saying cannot open correctly follow the below step

Open Android studio:

In windows go to the installation folder and open

android studio/bin and double click studio.bat

Change the Target of your android studio

Install SDK in android studio:

click SDK manager:

Select the desired SDK android version and click apply.

This will install the SDK:

Set Environment Variables:

goto windows and type edit environment variables and this two environment variable

Add the value as the path to which SDK is installed

Also add D:\MyProjects\Appium\Sdk\platform-tools to PATH

Configure emulator (Virtual device):

Click AVD Manager

Configure the device as you want and at the end use graphics as software ( use hardware only if you have a graphic card)

Install HAXM:

Hyper-V is a virtualization feature of Windows that makes it possible to run virtualized computer systems on a physical host computer. Intel’s Hardware Accelerated Execution Manager (HAXM). HAXM is a virtualization engine for computers running Intel CPUs.

Install system image:

Click play to start the simulator and then power it own:

Note:

If you get abd not found error then goto sdk installation folder delete sdk folder , reinstall sdk by going to sdk manager and select new sdk installation path

Then download https://github.com/appium/appium/raw/master/sample-code/apps/ApiDemos-debug.apk

Goto File>Profile or APK Debug (select Create a newfolder if prompted)

Now goto File > Project structure and

install jdk and select project sdk

Verify Installation:

To verify that all of Appium’s dependencies are met you can use appium-doctor. Install it with npm install -g appium-doctor, then run the appium-doctor command, supplying the --ios or --android flags to verify that all of the dependencies are set up correctly.

Check if device is find by adb driver:

ADB is a command line tool that allows users to control their Android device on their Windows PC, This is like usb driver which allows windows to detect the mobile device.

to check if the emulator is detected by the driver use below command

adb devices

Appium and Appium studio :

Appium allows to interact with mobile drivers and through that to the device or emulator

It also has inbuild inspector to inspect the elements locators

Install Appium:

goto : https://github.com/appium/appium-desktop/releases

Find the build with tag latest , download

the windows version

Install appium using npm:

you can also use appium as command line tool using npm , but you need appium studio to inspect elements anyways.

npm install -g appium

Start Appium studio:

click start server

Open element inspect:

Now add the capability:

click save. and then click start session

Eg capabilities : here we are telling the apk of the app we are testing and all other information.

{
"platformName": "Android",
"appium:platformVersion": "11",
"appium:deviceName": "Android Emulator",
"appium:app": "C:\Users\prave\Downloads\ApiDemos-debug.apk",
"appium:automationName": "UiAutomator2"
}

After starting session , inspect elements:

use the select element to find the locator and use red mark option to click any element,

Other buttons are self exploratory can be used to navigate through different views.

IF you want to goto another page just navigate to that page in emulator and click the refresh button 5th icon from left

Finding Current activity locator: ( Thanks to testsigma.com)

Activity is like url in web automation , you can use activity to navigate to a specific page in the app.

in windows use below command:

adb shell dumpsys window | find "mCurrentFocus"

in linux/mac :

adb shell dumpsys window | grep -E 'mCurrentFocus'

Output:

The blue marked part after u0 is the package name and the remaining section is the activity name

The end:

In the coming articles we will see how to use this information in the web autoamtion:

How to check if a file got downloaded in java selenium tests

How to check a file exists in system:

//we use import java.io.File;
File f = new File("D:\\program.txt");
f.exists(); // this will print true or false whether the file program.txt exists

We can use this logic to check if the file got downloaded and is available at the location.

But sometimes we need to click download button and wait for like few mins or seconds for the download to finish.

so in this case we need to poll for the file till it exists . We might need to try polling for a max of 5 mins then fail the tests if file doesn’t exists

This can be achieved using custom expected condition:

Custom expected condition:

Define below expected class in any of your page object class

public ExpectedCondition<Boolean> filepresent() {
return new ExpectedCondition<Boolean>() {
@Override
public Boolean apply(WebDriver driver) {
File f = new File("D:\\program.txt");
return f.exists();
}
        @Override
public String toString() {
return String.format("file to be present within the time specified");
}
};
}

And call it inside text as :

WebDriverWait wait = new WebDriverWait(driver,Duration.ofSeconds(2));
wait.until(pageobject.filepresent());

Output:

Failed:

Passed:

Passing request body multiform-data file source as variable in postman.

Issue:

In postman if we check the UI, we notice that there is no way to define file path as variable.

This looks like a limitation when we need to run file from different systems

Solution:

The solution is to hack the collection.json file. Open the json and edit the formdata src and replace it with a variable, let say fire_path so : {{fire_path}}

Now in Postman:

in pre request you can below code to set the path

pm.environment.set("file_path","C:/Users/guest/Desktop/1.png")

You can also save it as environment variable directly or pass through cmd using — env-var when using newman.

Note:

set access file from outside working directory as true (settings from top right corner)

How to connect OnePlus 6 to Appium studio.

https://experitest.com/mobile-test-automation/appium-studio/

Enable Developer mode in Oneplus:

Navigate to Settings>About and click Build Number multiple time

<you will get a message pop saying developer mode enabled>

Enabled Remote Debugging:

Goto Settings>System>Developer options>Debugging>USB Debugging and enable it:

Now search for device:

Open cmd and run:

adb devices

You will get prompt in phone for authorization accept it:

Select always allow from this computer

The output of abd devices command should be like:

Accept the prompt and execute the command till you get device instead of unauthorized as output of the command:

Open Appium studio:

Click Device>Android ( you can use the icon also for adding)

You don’t have anything to configure just click OK

Now click chrome and click record button:

Now see the screen: 😀

You can click home button to goto home:

I hope you love my cycle and Tattoo 😀


Originally published at http://learnwithpraveen.home.blog on November 16, 2020.

Git basic and important commands…

Creating Git local repository and connecting with remote repository:

Git init
Git remote add origin <url>
Git config --global user.email <anyemail>.com
Git config --global user.name <anyname>
Git push --set-upstream origin master

Cloning a repository:

git clone <repository_git_url>

Creating new remote branch:

git checkout -b <branch_name> 
git push origin <branch_name>

Delete a remote branch:

git push origin :<branch_name>

Delete a local Branch:

git branch -d branch_name
git branch -D branch_name

Note: -D deletes the branch even if the branch is not pushed yet ( its similar to — delete — force)

How to change the remote URL:

git remote set-url origin <url>

How to reset local changes:

git reset --hard origin/master

How to revert last commmit:

use below command to get commit id:

git log

revert:

git revert <commit hash>

How to checkout to different branch:

git checkout <branchname>

To push an old commit as final head

git checkout <commit-id>
//now make changes and commit it
git branch <new_branchname> //(create a new branch)
git push -f origin <new_branchname>:master
git checkout master
git branch -d <new_branchname>  // remove new temp branch

If merge conflic come , then just backup and delete the local repo and clone it again. CHeck whether you have the indended changes

How to test a pull request:

git remote add origin <url>
git pull
git fetch origin pull/<id>/head:branch-name
git checkout branch-name

Eg:

To test the below pull request:

copy the ID : 1479

copy the branch-name: fix-incorrect-override

use the below command:

git remote add origin https://github.com/DefectDojo/django-DefectDojo.git
git pull
git fetch origin pull/1479/head:fix-incorrect-override
git checkout fix-incorrect-override

Git ignore:

Sometimes you need to prevent git from uploading sensitive files to remote repository.

This could be done by creating a gitignore file that tells git not to track the sensitive files.

To create gitignore file , open git bash and enter below command

touch .gitignore   //will create the gitignore file

If files are already tracked, we should first untrack it else the rules in gitignore won’t come to effect.

git rm --cached <filename>

Now manually add files and folders to the .gitignore file

So, if we do git add . , the files add in .gitignore won’t be tracked

Note:

.gitignore file will get checked in and the rule gets applicable to all the users of the project

If you want to create rules locally only for you, then use your favorite text editor to open the file called .git/info/exclude within the root of your Git repository, to create ignore rules that need not be checked in. Any rule you add here will not be checked in, and will only ignore files for your local repository.

If you want to create git ignore globally for all git projects in your system, use below steps:

# Declare the global .gitignore
git config --global core.excludesfile ~/.gitignore_global
# Create the .gitignore_global file
touch .gitignore_global
# Go into edit mode so you can add the unwanted file listing
vim .gitignore_global

Renaming a remote branch:

# Rename branch locally  
#if you are in a different branch
git branch -m old_branch new_branch
OR
#if already in the old branch
git branch -m new_branch
# Delete the old branch      
git push origin :old_branch
# Push the new branch, set local branch to track the new remote  
git push --set-upstream origin new_branch

Sending text to fields for which no known locators.

Question:

https://sqa.stackexchange.com/questions/42251/how-to-interact-with-ngx-monaco-editor

Answer:

If you are not sure about the locator, then you can use the action class sendKeys method to interact with the field.

Here, it interacts with the active (currently focused ) element.

So the first step is to bring the element to focus, this can be done by just clicking it:

await browser.get('https://stackblitz.com/edit/ngx-monaco-editor-example')      
await browser.sleep(10000)
await $('[class="view-line"]').click()
await browser.sleep(4000)

Now you can see the cursor is at the below place:

Now you can interact with the element using browser.actions():

await browser.actions().sendKeys('This is test').perform();

this will send input to the currently active element:

Now let us look deeper to find out the locator:

We now know that the sendKey using action works, so we can find the locator from the active element:

The outerHTML of the active element gives the locator:

await  $('[class="view-line"]').click()
let test = await browser.driver.switchTo().activeElement()
console.log("outer");
console.log(await test.getAttribute('outerHTML'))
//await test.sendKeys("a=1;c=a+10;") if you try this you can see even this sends data

Output:

<textarea data-mprt="6" class="inputarea" wrap="off" autocorrect="off" autocapitalize="off" autocomplete="off" spellcheck="false" aria-label="Editor content;Press Alt+F1 for Accessibility Options." role="textbox" aria-multiline="true" aria-haspopup="false" aria-autocomplete="both" style="font-size: 1px; line-height: 18px; top: 0px; left: 562px; width: 1px; height: 1px;"></textarea>

So the input element is the text area, and you can send data to this element. Try

$('textarea[class="inputarea"]').sendKeys('something');

Note: you can use this approach of getting outer HTML of the active element in cases where you are not sure about the element but browser actions work.

Summary:

So you can use two approaches:

1:

await elem.click()
await browser.actions().sendKeys('This is test').perform();

2:

await elem.click()
let field= await browser.driver.switchTo().activeElement()
await field.sendKeys("HI");

you can find the locator or element as:

await field.getAttribute('outerHTML');