So from the previous article , you understand how to send data and visualize it in Elastic search
We have observed that we are just sending json data using rest API and then visualizing it in Kibana by setting x and y axis with the fields we are interested in.
so to visualize the protractor result we just have to send the result to ELastic search , this can be done using jasmine customreporter listeners .
in the protractor config file add : (do npm install axios)
        //adding results to an array for each spec
        specDone: function(result) {
            console.info(JSON.stringify(result, null, 2))
            array.push(result)
        },
        //iterating through each result and sending it to elastic search
        jasmineDone: function() {
            date = new Date(Date.now())
            var axios = require('axios');
            array.forEach((result) => {
                result.date = date
                var data = JSON.stringify(result);
Now you can interact with the element using browser.actions():
await browser.actions().sendKeys('This is test').perform();
this will send input to the currently active element:
Now let us look deeper to find out the locator:
We now know that the sendKey using action works, so we can find the locator from the active element:
The outerHTML of the active element gives the locator:
await  $('[class="view-line"]').click()
let test = await browser.driver.switchTo().activeElement()
console.log("outer");
console.log(await test.getAttribute('outerHTML'))
//await test.sendKeys("a=1;c=a+10;") if you try this you can see even this sends data
Note: you can use this approach of getting outer HTML of the active element in cases where you are not sure about the element but browser actions work.
Summary:
So you can use two approaches:
1:
await elem.click()
await browser.actions().sendKeys('This is test').perform();
2:
await elem.click()
let field= await browser.driver.switchTo().activeElement()
await field.sendKeys("HI");
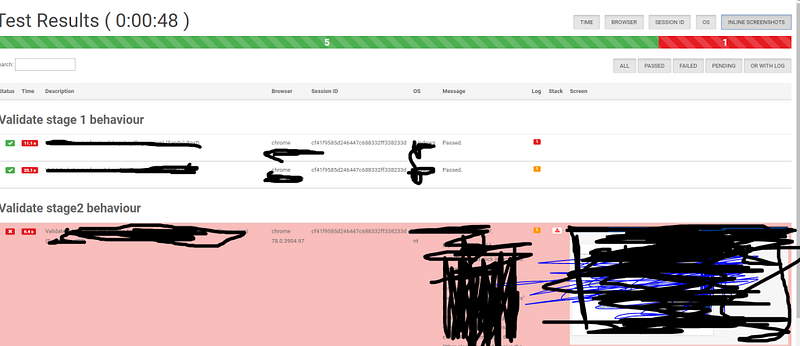
We have seen how to create reports in our previous article, but that report used to break when we have test case names with a special character or long names.
So I came across a better report and let’s see how to implement it.
Note: Drawback of this report is that you cannot send it as an attachment as it is dependent on many files. It won’t work as standalone,
So you can use both this report and the old report together and use this one for debugging and the other one as a summary to send along with emails.
    it('Validate that error message in all fields given uploaded {Regression} {Smoke} {Sanity}', async function () {
        await stage1.goto()
        await stage1.sendValue('hi')
        await browser.sleep(5000)
    });
Note:
This works even if the page object is defined as a function
For protractor-cucumber add the same in before hook :
you should add the hook in the step definition file itself and not in separate hook.js:
"use strict";
let {Given,Before} = require('cucumber');
let decache = require('decache');
let stage1 = require('../pageobjects/stage1.js');
Before(async function (scenario) {
  decache('../pageobjects/stage1.js');
  stage1 = require('../pageobjects/stage1.js');
  await browser.sleep(4000)
});
 Given('I navigates to google', async() => {
     await stage1.goto()
   });
let parser = require('csv-parser-sync-plus-promise')
Use as sync:
let a=parser.readCsvSync('')
Use as Promise:
let b=parser.readCsvPromise('')
it('test {Regression} {Sanity} {Sanity}', async function () {
console.log(await b);
});
Protractor test:
Use the demo csv ‘1.csv’
'use strict';
let parser = require('csv-parser-sync-plus-promise')
let testdata=parser.readCsvSync('<full_path>/1.csv');
describe('Validate dfsfdsf 1 behaviour', function () {

  for(let i of testdata){
    it('test {Regression} {Sanity} {Sanity}', async function () {
    console.log(i.a);
    console.log(i.b);
    console.log(i.c);
    expect(Number(i.a)+Number(i.b)).toBe(Number(i.c))
    });
  }
});
cucumber :npm install cucumber (If protractor was installed locally else use npm install -g cucumber). Both protractor and cucumber should be in same scope.
//set cucumber options
cucumberOpts: {
     require: ['./testsuites/*.js','./commons/chaiAssertions.js','./commons/hooks.js'],
     strict: true,
     format: [],    //don't put 'Pretty' as it is depreciated
     'dry-run': false,
     compiler: [],
     format: 'json:results.json',    //make sure you are not using multi-capabilities
   },
SELENIUM_PROMISE_MANAGER: false,
 };
Here, i point to the feature file using the property specs: [‘feature/*.feature’],
and glues it to the step definition using cucumberopts> require:
There is no one to one mapping between feature and step definition, the framework automatically finds the step definition that contains the definition for the step from provided step definitions(.js files) in the require field.
Now write feature file:
test.feature
Feature: Google search
 Scenario Outline: Log in with given API
     Given I navigates to google
     And searches for '
'
     Then I should see ''
 Examples:
 |input|this|
 |test|pass|
 |test2|fail|
Now write step definition:
step.js:
var { Given } = require('cucumber');
 Given('I navigates to google', async function () {
   await browser.get('https://www.google.com/');
 });
 Given('searches for {string}', async function (searchValue) {
   await element(by.css('input[role="combobox"]')).sendKeys(searchValue)
 });
 Given('I should see {string}', async function (expectedValue) {
   expect(expectedValue).to.equal('pass')
 });
so here we are using just Given as during runtime Given ,when then etc will be ignored and only the string after that will be considered
So, even if our feature file has And searches for ‘input’ , we can write step definition as Given(‘searches for {string}’.
Note that we are not using regular expressions to get parameters but the data type.
you might have seen in other tutorials , Given( /^searches for (\w+)$/ ). Its simpler to use the format i have used Given(‘searches for {string}’. Both the approaches works works fine.
Click inspect and click F8 and click run. The exection stops at ‘debugger’ line and now add manual break points ow goto the file using the tabs and add manual break points.
But still, you can continue reading and see any of the features would be useful for you:
First, let us see why need reporting
Imagine you have written thousands was of wonderful test cases and you have put up it in CI/CD pipeline. You must be feeling proud right? and here the news that the first test runs for the suites you have written will run over the night and you get all excited.
Next day you come to the office and sees the below console logs:
And you have no clue what passed, what failed because the execution got interrupted and was not completed.
Printing test status and logs after each test-case execution:
Add the below code to the protractor config file:
This enables real-time reporting, allowing to print errors onto console without having to wait for the test suite to finish executing.
// so the xml file will be stored in current directory as guitest-xmloutput
Output:
Lets now create a HTML report
This report can’t be send to a Business analyst or any other non-tech guy right!!! lets add some visual treats using HTML.
The below npm tool takes the xml file we created in the previous section and converts it too HTML. The result will be stored in the current directory as ProtractorTestReport.html
The code gets browser name, version etc from the capabilities property, and the suite and test case name, from ‘describe’ and ‘it’ functions in spec.
You can install the tool through npm:
npm i protractor-html-reporter-2
Now add below code to conf.js
exports.config = {

   onComplete: function() {
     var browserName, browserVersion;
     var capsPromise = browser.getCapabilities();