Protractor best HTML report…

We have seen how to create reports in our previous article, but that report used to break when we have test case names with a special character or long names.

So I came across a better report and let’s see how to implement it.

Note: Drawback of this report is that you cannot send it as an attachment as it is dependent on many files. It won’t work as standalone,

So you can use both this report and the old report together and use this one for debugging and the other one as a summary to send along with emails.

Install protractor-beautiful-reporter

npm install protractor-beautiful-reporter --save-dev

Add below code to OnPrepare of the config file:

framework: 'jasmine',
onPrepare: function(){
let HtmlReporter = require('protractor-beautiful-reporter');
jasmine.getEnv().addReporter(new HtmlReporter({
baseDirectory: 'reports_new',
screenshotsSubfolder: 'screenshotsOnFailure',
takeScreenShotsOnlyForFailedSpecs: true,
jsonsSubfolder: 'jsonFiles',
excludeSkippedSpecs: true,
preserveDirectory: false,
clientDefaults:{
showTotalDurationIn: "header",
totalDurationFormat: "h:m:s",
gatherBrowserLogs: true
},
}).getJasmine2Reporter());
}

Report:

Creating HTML reports for protractor

Note: I have found an easier and better report for protractor by sauce lab use that report instead:

Read about the new report at: https://medium.com/@praveendavidmathew/protractor-best-html-report-d548d1460c36

But still, you can continue reading and see any of the features would be useful for you:

First, let us see why need reporting

Imagine you have written thousands was of wonderful test cases and you have put up it in CI/CD pipeline. You must be feeling proud right? and here the news that the first test runs for the suites you have written will run over the night and you get all excited.

Next day you come to the office and sees the below console logs:

And you have no clue what passed, what failed because the execution got interrupted and was not completed.

Printing test status and logs after each test-case execution:

Add the below code to the protractor config file:

This enables real-time reporting, allowing to print errors onto console without having to wait for the test suite to finish executing.

exports.config = {
onPrepare: function(){
const SpecReporter = require('jasmine-spec-reporter').SpecReporter;
jasmine.getEnv().addReporter(new SpecReporter({
spec: {
displayStacktrace: true
}
}));
}
}

To make this work we need to install jasmine-spec-reporter

npm i jasmine-spec-reporter

Output:

So we can know when something goes wrong in the suite without wasting time waiting for it to finish executing.

Now lets create the Jasmine XML report :

Now lets believe that things went well, how will you report this to other stakeholders ? how will you show the status of the last test execution?

The answer is to use the jasmine xml report:

Install it using npm:

npm i jasmine-reporters

Add the below line in conf.js

exports.config = {

onPrepare: function(){
//configure junit xml report
var jasmineReporters = require('jasmine-reporters');
jasmine.getEnv().addReporter(new jasmineReporters.JUnitXmlReporter({
consolidateAll: true,
filePrefix: 'guitest-xmloutput',
savePath: '.'
}));
}
}
// so the xml file will be stored in current directory as guitest-xmloutput

Output:

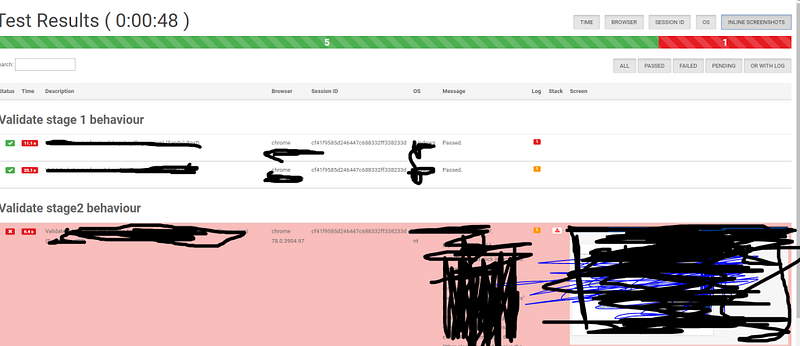
Lets now create a HTML report

This report can’t be send to a Business analyst or any other non-tech guy right!!! lets add some visual treats using HTML.

The below npm tool takes the xml file we created in the previous section and converts it too HTML. The result will be stored in the current directory as ProtractorTestReport.html

The code gets browser name, version etc from the capabilities property, and the suite and test case name, from ‘describe’ and ‘it’ functions in spec.

You can install the tool through npm:

npm i protractor-html-reporter-2

Now add below code to conf.js

exports.config = {

onComplete: function() {
var browserName, browserVersion;
var capsPromise = browser.getCapabilities();
capsPromise.then(function (caps) {
browserName = caps.get('browserName');
browserVersion = caps.get('version');
platform = caps.get('platform');
var HTMLReport = require('protractor-html-reporter-2');
testConfig = {
reportTitle: 'Protractor Test Execution Report',
outputPath: './',
outputFilename: 'ProtractorTestReport',
screenshotPath: './screenshots',
testBrowser: browserName,
browserVersion: browserVersion,
modifiedSuiteName: false,
screenshotsOnlyOnFailure: true,
testPlatform: platform
};
new HTMLReport().from('guitest-xmloutput.xml', testConfig);
});
},
}

Output:

Taking screenshots on failure:

you can take screen shot on test failures by using fs-extra, to install use below command:

npm i fs-extra

Now add below command to conf.js

exports.config = {

onPrepare: function(){
var fs = require('fs-extra');
fs.emptyDir('screenshots/', function (err) {
console.log(err);
});
jasmine.getEnv().addReporter({
specDone: function(result) {
if (result.status == 'failed') {
browser.getCapabilities().then(function (caps) {
var browserName = caps.get('browserName');
browser.takeScreenshot().then(function (png) {
var stream = fs.createWriteStream('screenshots/' + browserName + '-' + result.fullName+ '.png');
stream.write(new Buffer.from(png, 'base64'));
stream.end();
});
});
}
}
});
}
}

Screenshots will be taken and stored in ‘screenshots’ folder in the current directory.

Output:

Adding screenshots to html report:

Adding the above code to Onprepare property of protractor conf.js, ensures that on failure, screenshots are captured and stored on screenshots folder

The protractor-html tool will look for screenshots in this folder and add to the report automatically

output:

Final Config.js

exports.config = {
specs: ['spec.js'],
onPrepare: function(){
// Getting CLI report
      const SpecReporter = require('jasmine-spec-reporter').SpecReporter;
jasmine.getEnv().addReporter(new SpecReporter({
spec: {
displayStacktrace: true
}
}));

//Getting XML report
    var jasmineReporters = require('jasmine-reporters');
jasmine.getEnv().addReporter(new jasmineReporters.JUnitXmlReporter({
consolidateAll: true,
filePrefix: 'guitest-xmloutput',
savePath: '.'
}));
//Getting screenshots
  var fs = require('fs-extra');
fs.emptyDir('screenshots/', function (err) {
console.log(err);
});
jasmine.getEnv().addReporter({
specDone: function(result) {
if (result.status == 'failed') {
browser.getCapabilities().then(function (caps) {
var browserName = caps.get('browserName');
browser.takeScreenshot().then(function (png) {
var stream = fs.createWriteStream('screenshots/' + browserName + '-' + result.fullName+ '.png');
stream.write(new Buffer.from(png, 'base64'));
stream.end();
});
});
}
}
});
},
  onComplete: function() {
//Getting HTML report
var browserName, browserVersion;
var capsPromise = browser.getCapabilities();
capsPromise.then(function (caps) {
browserName = caps.get('browserName');
browserVersion = caps.get('version');
platform = caps.get('platform');
var HTMLReport = require('protractor-html-reporter-2');
testConfig = {
reportTitle: 'Protractor Test Execution Report',
outputPath: './',
outputFilename: 'ProtractorTestReport',
screenshotPath: './screenshots',
testBrowser: browserName,
browserVersion: browserVersion,
modifiedSuiteName: false,
screenshotsOnlyOnFailure: true,
testPlatform: platform
};
new HTMLReport().from('guitest-xmloutput.xml', testConfig);
});
}
}